When HG2 graphics was finally released in R2014b, I posted a series of articles about various undocumented ways by which we can customize Matlab’s new graphic axes: rulers (axles), baseline, box-frame, grid, back-drop, and other aspects. Today I extend this series by showing how we can customize the axes rulers’ crossover location.
Clik here to view.

Non-default axes crossover location
The documented/supported stuff
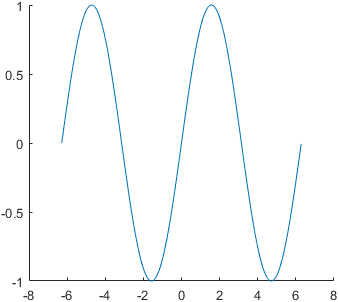
Until R2015b, we could only specify the axes’ YAxisLocation as 'left' (default) or 'right', and XAxisLocation as 'bottom' (default) or 'top'. For example:
x = -2*pi : .01 : 2*pi;
plot(x, sin(x));
hAxis = gca;
hAxis.YAxisLocation = 'left';    % 'left' (default) or 'right'
hAxis.XAxisLocation = 'bottom';  % 'bottom' (default) or 'top'
Clik here to view.

Default axis locations: axes crossover is non-fixed
The crossover location is non-fixed in the sense that if we zoom or pan the plot, the axes crossover will remain at the bottom-left corner, which changes its coordinates depending on the X and Y axes limits.
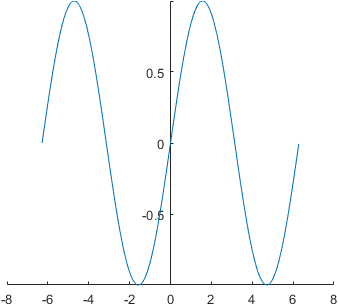
Since R2016a, we can also specify 'origin' for either of these properties, such that the X and/or Y axes pass through the chart origin (0,0) location. For example, move the YAxisLocation to the origin:
hAxis.YAxisLocation = 'origin';
Clik here to view.

Y-axis location at origin: axes crossover at 0 (fixed), -1 (non-fixed)
And similarly also for XAxisLocation:
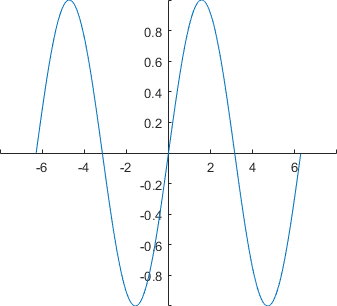
hAxis.XAxisLocation = 'origin';
Clik here to view.

X and Y-axis location at origin: axes crossover fixed at (0,0)
The axes crossover location is now fixed at the origin (0,0), so as we move or pan the plot, the crossover location changes its position in the chart area, without changing its coordinates. This functionality has existed in other graphic packages (outside Matlab) for a long time and until now required quite a bit of coding to emulate in Matlab, so I’m glad that we now have it in Matlab by simply updating a single property value. MathWorks did a very nice job here of dynamically updating the axles, ticks and labels as we pan (drag) the plot towards the edges – try it out!
The undocumented juicy stuff
So far for the documented stuff. The undocumented aspect is that we are not limited to using the (0,0) origin point as the fixed axes crossover location. We can use any x,y crossover location, using the FirstCrossoverValue property of the axes’ hidden XRuler and YRuler properties. In fact, we could do this since R2014b, when the new HG2 graphics engine was released, not just starting in R2016a!
% Set a fixed crossover location of (pi/2,-0.4)
hAxis.YRuler.FirstCrossoverValue = pi/2;
hAxis.XRuler.FirstCrossoverValue = -0.4;
Clik here to view.

Custom fixed axes crossover location at (π/2,-0.4)
The rulers also have a SecondCrossoverValue property (default = -inf), but I do know know [yet] how it is used (it does not seem to be related to plotyy). If anyone discovers, please post a comment below.
Labels
Users will encounter the following unexpected behavior (bug?) when using either the documented *AxisLocation or the undocumented FirstCrossoverValue properties: when setting an x-label (using the xlabel function, or the internal axes properties), the label moves from the center of the axes (as happens when XAxisLocation=’top’ or ‘bottom’) to the right side of the axes, where the secondary label (e.g., exponent) usually appears, whereas the secondary label is moved to the left side of the axis:
Clik here to view.

Unexpected label positions
In such cases, we would expect the labels locations to be reversed, with the main label on the left and the secondary label in its customary location on the right. The exact same situation occurs with the Y labels, where the main label unexpectedly appears at the top and the secondary at the bottom. Hopefully MathWorks will fix this in the next release (it is probably too late to make it into R2016b, but hopefully R2017a). Until then, we can simply switch the strings of the main and secondary label to make them appear at the expected locations:
% Switch the Y-axes labels:
ylabel(hAxis, '\times10^{3}');  % display secondary ylabel (x10^3) at top
set(hAxis.YRuler.SecondaryLabel, 'Visible','on', 'String','main y-label');  % main label at bottom

% Switch the X-axes labels:
xlabel(hAxis, '2^{nd} label');  % display secondary xlabel at right
set(hAxis.XRuler.SecondaryLabel, 'Visible','on', 'String','xlabel');  % main label at left
As can be seen from the screenshot, there’s an additional nuisance: the main label appears a bit larger than the axes font size (the secondary label uses the correct font size). This is because by default Matlab uses a 110% font-size for the main axes label, ostensibly to make them stand out. We can modify this default factor using the rulers’ hidden LabelFontSizeMultiplier property (default=1.1). For example:
hAxis.YRuler.LabelFontSizeMultiplier = 1;   % use 100% font-size (same as tick labels)
hAxis.XRuler.LabelFontSizeMultiplier = 0.8; % use 80% (smaller than standard) font-size
Note: I described the ruler objects in my first article of the axes series. Feel free to read it for more ideas on customizing the axes rulers.
Clik here to view.
Clik here to view.
Clik here to view.
Clik here to view.
Clik here to view.
Clik here to view.
Clik here to view.