I would like to introduce guest blogger Scott Koch. Scott is part of the development team at Eigenvector Research Inc., makers of PLS_Toolbox, a commercial chemometrics and multivariate data analysis toolbox. Today Scott will expand on JGraph, a Java-based open source graph visualization and diagramming library.
What is JGraph?
JGraph is an interactive Java-based diagramming and graph visualization library. The maintainers of JGraph have a product family that includes a Java Swing library (open-source), a JavaScript library (proprietary commercial), as well as other technologies. They call their product family “mxGraph”, and the Swing product specifically as “JGraphX”. The Swing library is available on GitHub and licensed under BSD. I will refer to the Swing library as JGraph, since that was the original library’s name until it was completely redesigned some years ago and renamed JGraphX. You can read additional information on JGraph and access various documentation alternatives in its README file.
Graphing is a powerful visualization tool that has not yet been integrated into the core Matlab product. I assume that this will be rectified by MathWorks in a future Matlab release. But until that time, or even later if you are still using R2015a or older, we do not have a solution in the core Matlab. In our toolbox product, we use a cleverly designed image to display a simple diagram, but I always thought it would be nice to have a “real” diagramming tool that was interactive and full-featured.
So, as a long time follower of Yair’s blog, I was thrilled to see his post several years ago about integrating Java libraries for charting and diagramming in Matlab figures. Unfortunately, my first attempts at getting JGraph to work in Matlab were not very successful. Thanks to a comment on that original post by Markus Behle, I was able to gain full access to JGraph in Matlab. Today’s post will show how we can use JGraph in Matlab.

Creating a new JGraph edge in a Matlab figure
Creating a simple graph
To install JGraph, first download the JGraph zip file, extract it in some folder, and then add the contained JGraph jar file to your Matlab’s Java path:
javaaddpath('jgraphx/lib/jgraphx.jar');
Having installed JGraph, we can now create graphs pretty easily in Matlab – see Yair’s original post for details.
Unfortunately, dragging doesn’t work and that’s a bummer. To enable dragging, create a custom graph component. I posted a followup comment showing how to do this. Note that the following code will work without creating a custom graph component but you won’t be able to drag (and drop).
In JGraph, a graph is made up of cells. A cell can be a vertex (node) or edge (connector). A cell can also hold other cells in a group.
Below is a code snippet similar to Yair’s original JGraph post, except we’ll use the custom graph component from above and add an additional vertex:
% Make the graph object
graph = javaObjectEDT('mymxGraph’);

% If not using custom graph component use the following
% graph = javaObjectEDT('com.mxgraph.view.mxGraph');

% Get the parent cell
parent = graph.getDefaultParent();

% Group update
graph.getModel().beginUpdate();

% Add some child cells
v1 = graph.insertVertex(parent, '', 'Hello', 240, 150, 80, 30);
v2 = graph.insertVertex(parent, '', 'World',  20,  20, 80, 30);
v3 = graph.insertVertex(parent, '', 'Vertex', 20, 150, 80, 30);
graph.insertEdge(parent, '', 'Edge', v1, v2);

graph.getModel().endUpdate();

% Get scrollpane
graphComponent = com.mxgraph.swing.mxGraphComponent(graph);

% Make a figure and stick the component on it
f = figure('units','pixels');
pos = get(f,'position');
mypanel = javax.swing.JPanel(java.awt.BorderLayout);
mypanel.add(graphComponent);
[obj, hcontainer] = javacomponent(mypanel, [0,0,pos(3:4)], f);

% Normalize units so resize works better
set(hcontainer,'Units','normalized');
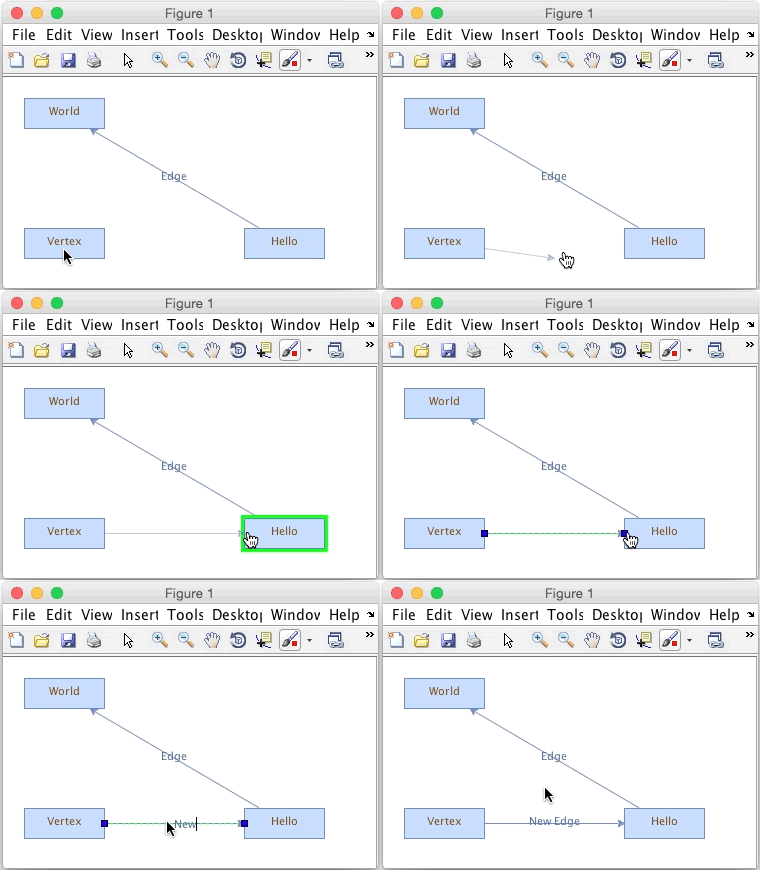
We have 3 vertices and a single edge connecting two vertices. Each has a label. By default you can edit the labels and drag the vertices and edges. If you mouse over the middle of a vertex it will highlight, indicating that if you click and drag, you will be able to add an edge. Dragging the edge to another vertex will connect it. You can also resize and reposition vertices, as well as set edge labels, as shown in the animated image above.
Customizing graphs with HTML and CSS
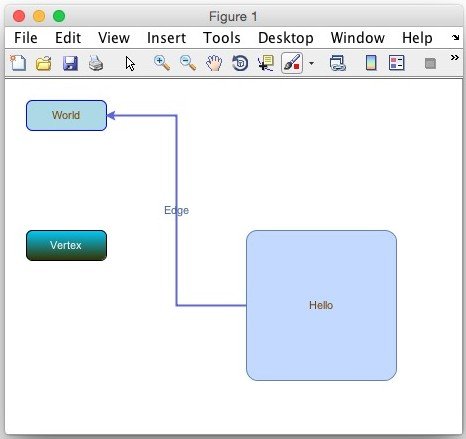
If you look at online examples of JGraph, you can see there are lots of options for customizing your graph’s appearance. JGraph uses “styles” on vertices and edges, which are similar in concept to Cascading Style Sheets (CSS). You can add style information when you create a vertex, or by using the Graph Model. Rerun the code above with the following lines substituted:
v1 = graph.insertVertex(parent, '', 'Hello', 240, 150, 150, 150, 'rounded=1;');
v2 = graph.insertVertex(parent, '', 'World',  20,  20,  80,  30, 'rounded=1;strokeColor=blue;fillColor=lightblue');
v3 = graph.insertVertex(parent, '', 'Vertex', 20, 150,  80,  30, 'rounded=1;strokeColor=#000000;fillColor=#00CCFF;gradientColor=#333300;fontColor=white');
graph.insertEdge(parent, '', 'Edge', v1, v2, 'edgeStyle=elbowEdgeStyle;strokeColor=#5d65df;strokeWidth=2');

Simple JGraph with new styles
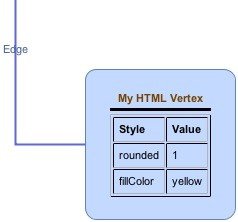
As Yair has taught us, most Java controls can render HTML. JGraph is no different, you just need to turn it on and add HTML to your label:
>> graph.setHtmlLabels(true);
>> htmltxt = ['<html><b>My HTML Vertex</b><hr noshade size=''3''>'...
              '<table border=1 cellspacing=1 cellpadding=5 '...
              'font color="#0000FF" FONT COLOR="black">'...
              '<tr><td><b>Style</b></td><td><b>Value</b></td></tr>'...
              '<tr><td>rounded</td><td>1</td></tr>'...
              '<tr><td>fillColor</td><td>yellow</td></tr>'...
              '</table></html>'];
>> v1.setValue(htmltxt)
>> graph.refresh

Vertex with HTML label
Adding a callback
Let’s add more functionality to our graph by adding a callback. To do this, we need to add a mouse-clicked callback to the graph scrollpane:
% Handle the scrollpane and add a click callback
scrollpanehandle = handle(graphComponent.getGraphControl, 'CallbackProperties');
set(scrollpanehandle, 'MouseClickedCallback', {@mouseClickCallback,f})
With a click callback in place, we can interrogate the click event and graph to determine what object is under the click. If the click happens over a vertex, a context menu is displayed allowing changing of the fill color.
function mouseClickCallback(Obj,eventData,myFig)
   %Graph mouse click callback

   %Extract graph object
   graphcomponent = Obj.getGraphContainer;
   graph = graphcomponent.getGraph;
   figpos = get(myFig,'position');

   %Get cell under click if it's there
   mycell = graphcomponent.getCellAt(eventData.getX,eventData.getY);

   if isempty(mycell) || mycell.isEdge
      %Clicking in open space
      return
   end

   if javax.swing.SwingUtilities.isRightMouseButton(eventData)
      mymenu = findobj(myFig,'tag','backgroundmenu');
      if isempty(mymenu)
         %Create context menu
         mymenu = uicontextmenu('tag','backgroundmenu');
         uimenu(mymenu,'Tag','graymenu','Label','Gray Background');
         uimenu(mymenu,'Tag','bluemenu','Label','Blue Background');
      end

      %Update callback with current cell object
      set(findobj(mymenu,'tag','graymenu'),'callback',{@changeFillColor,graph,mycell,'gray'});
      set(findobj(mymenu,'tag','bluemenu'),'callback',{@changeFillColor,graph,mycell,'blue'});

      %Show context menu
      set(mymenu,'position', [eventData.getX+8 figpos(4)-eventData.getY-8]);
      set(mymenu,'visible','on');
   end
end

function changeFillColor(Obj,eventData,varargin)
   % Change cell fill color

   %Pull graph object, current cell object, and new color value out of varargin
   mygraph = varargin{1};
   mycell = varargin{2};
   newcolor = varargin{3};

   %Get current style
   mystyle = char(mycell.getStyle);

   %Chop string into cells and locate fillcolor cell
   stylecell = strsplit(mystyle,';');
   fcloc = ~cellfun('isempty',strfind(stylecell,'fillColor='));

   %Make new fillcolor string
   switch newcolor
      case 'gray'
         newcolor = 'fillColor=#E8E8E8';
      case 'blue'
         newcolor = 'fillColor=#A9BCF5';
   end

   %Add new color into style
   if any(fcloc)
      stylecell{fcloc} = newcolor;
   else
      stylecell{end+1} = newcolor;
   end

   %Join styles back into single style string
   mystyle = strjoin(stylecell,';');

   %Set new style
   mygraph.getModel.setStyle(mycell,mystyle);
end
Conclusions
Hopefully this post gave enough information to get started making attractive and useful graphs with Matlab and JGraph. There is a lot of functionality included with JGraph and we’ve only scratched the surface today. I hope to have a future post discussing Groups, Drag and Drop, Layout Engines, and a few other topics that build upon what was discussed today.
Here are a few resources that could help you get started:
- Online (JavaScript) demo: https://www.draw.io
- Style demo: http://blog.draw.io/mxgraph-cell-styles
- JGraph Forum: http://forum.jgraph.com/questions
- List of styles (properties starting with “
STYLE_“): https://github.com/jgraph/jgraphx/blob/master/src/com/mxgraph/util/mxConstants.java - Yair’s post on integrating JGraph and JGraphT in Matlab: http://undocumentedmatlab.com/blog/jgraph-and-bde
Addendum September 4, 2015: Matlab R2015b has just been released and includes very interesting new functionality supporting graph algorithms and visualization (additional details).
Related posts:
- JGraph and BDE This article shows how to display graph-theory diagrams in Matlab using several different Java libraries...
- Disabling menu entries in deployed docked figures Matlab's standard menu items can and should be removed from deployed docked figures. This article explains how. ...
- Docking figures in compiled applications Figures in compiled applications cannot officially be docked since R2008a, but this can be done using a simple undocumented trick....
- Matlab-Java interface using a static control The switchyard function design pattern can be very useful when setting Matlab callbacks to Java GUI controls. This article explains why and how....