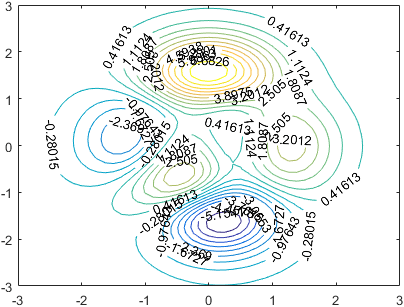
One of my clients asked me last week whether it is possible to access and customize individual contour lines and labels in HG2 (Matlab’s new graphics system, R2014+). Today’s post will discuss how this could indeed be done.

Matlab contour plot
hggroup objects that incorporated text and patch child handles. The contour labels, lines and fill patches could easily be accessed via these child handles (contour lines and fills use the same patch object: the lines are simply the patch edges; fills are their faces). The lines could then be customized, the label strings changed, and the patch faces (fills) recolored:[X,Y,Z] = peaks; [C,hContour] = contour(X,Y,Z,20, 'ShowText','on'); hChildren = get(hContour, 'Children'); set(hChildren(1), 'String','Yair', 'Color','b'); % 1st text (contour label) set(hChildren(end), 'EdgeColor',[0,1,1]); % last patch (contour line)
The problem is that in HG2 (R2014b onward), contour (and its sibling functions, contourf etc.) return a graphic object that has no accessible children. In other words, hContour.Children returns an empty array:
>> hContour.Children
ans =
  0x0 empty GraphicsPlaceholder array.
>> allchild(hContour)
ans =
  0x0 empty GraphicsPlaceholder array.
>> isempty(hContour.Children)
ans =
     1
So how then can we access the internal contour patches and labels?
HG2′s contour object’s hidden properties
Skipping several fruitless dead-ends, it turns out that in HG2 the text labels, lines and fills are stored in undocumented hidden properties called TextPrims, EdgePrims and (surprise, surprise) FacePrims, which hold corresponding arrays of matlab.graphics.primitive.world.Text, matlab.graphics.primitive.world.LineStrip and matlab.graphics.primitive.world.TriangleStrip object handles (the drawnow part is also apparently very important, otherwise you might get errors due to the Prim objects not being ready by the time the code is reached):
>> drawnow;  % very important!
>> hContour.TextPrims  % row array of Text objects
ans =
  1x41 Text array:

  Columns 1 through 14
    Text    Text    Text    Text    Text    Text    Text    Text    Text    Text    Text    Text    Text    Text
  Columns 15 through 28
    Text    Text    Text    Text    Text    Text    Text    Text    Text    Text    Text    Text    Text    Text
  Columns 29 through 41
    Text    Text    Text    Text    Text    Text    Text    Text    Text    Text    Text    Text

>> hContour.EdgePrims  % column array of LineStrip objects
ans =
  20x1 LineStrip array:

  ineStrip
  LineStrip
  LineStrip
  ...

>> hContour.FacePrims  % column array of TriangleStrip objects (empty if no fill)
ans =
  0x0 empty TriangleStrip array.
We can now access and customize the individual contour lines, labels and fills:
hContour.TextPrims(4).String = 'Dani';
hContour.TextPrims(7).Visible = 'off';
hContour.TextPrims(9).VertexData = single([-1.3; 0.5; 0]);  % Label location in data units

hContour.EdgePrims(2).ColorData = uint8([0;255;255;255]);  % opaque cyan
hContour.EdgePrims(5).Visible = 'off';
Note that the LineStrip objects here are the same as those used for the axes Axles, which I described a few months ago. Any customization that we could do to the axle LineStrips can also be applied to contour LineStrips, and vice versa.
For example, to achieve the appearance of a topographic map, we might want to modify some contour lines to use dotted LineStyle and other lines to appear bold by having larger LineWidth. Similarly, we may wish to hide some labels (by setting their Visible property to ‘off’) and make other labels bold (by setting their Font.Weight property to ‘bold’). There are really numerous customization possibilities here.
Here is a listing of the standard (non-hidden) properties exposed by these objects:
>> get(hContour.TextPrims(1))
        BackgroundColor: []
              ColorData: []
              EdgeColor: []
                   Font: [1x1 matlab.graphics.general.Font]
          FontSmoothing: 'on'
       HandleVisibility: 'on'
                HitTest: 'off'
    HorizontalAlignment: 'center'
            Interpreter: 'none'
                  Layer: 'middle'
              LineStyle: 'solid'
              LineWidth: 1
                 Margin: 1
                 Parent: [1x1 Contour]
          PickableParts: 'visible'
               Rotation: 7.24591082075548
                 String: '-5.1541'
          StringBinding: 'copy'
             VertexData: [3x1 single]
      VerticalAlignment: 'middle'
                Visible: 'on'

>> get(hContour.EdgePrims(1))
          AlignVertexCenters: 'off'
             AmbientStrength: 0.3
                ColorBinding: 'object'
                   ColorData: [4x1 uint8]
                   ColorType: 'truecolor'
             DiffuseStrength: 0.6
            HandleVisibility: 'on'
                     HitTest: 'off'
                       Layer: 'middle'
                     LineCap: 'none'
                    LineJoin: 'round'
                   LineStyle: 'solid'
                   LineWidth: 0.5
               NormalBinding: 'none'
                  NormalData: []
                      Parent: [1x1 Contour]
               PickableParts: 'visible'
    SpecularColorReflectance: 1
            SpecularExponent: 10
            SpecularStrength: 0.9
                   StripData: [1 18]
                     Texture: [0x0 GraphicsPlaceholder]
                  VertexData: [3x17 single]
               VertexIndices: []
                     Visible: 'on'
       WideLineRenderingHint: 'software'

>> get(hContour.FacePrims(1))
             AmbientStrength: 0.3
             BackFaceCulling: 'none'
                ColorBinding: 'object'
                   ColorData: [4x1 uint8]
                   ColorType: 'truecolor'
             DiffuseStrength: 0.6
            HandleVisibility: 'on'
                     HitTest: 'off'
                       Layer: 'middle'
               NormalBinding: 'none'
                  NormalData: []
                      Parent: [1x1 Contour]
               PickableParts: 'visible'
    SpecularColorReflectance: 1
            SpecularExponent: 10
            SpecularStrength: 0.9
                   StripData: [1 4 13 16 33 37 41 44 51 54 61 64 71 74 87 91 94 103]
                     Texture: [0x0 GraphicsPlaceholder]
            TwoSidedLighting: 'off'
                  VertexData: [3x10² single]
               VertexIndices: []
                     Visible: 'on'
But how did I know these properties existed? The easiest way in this case would be to use my getundoc utility, but we could also use my uiinspect utility or even the plain-ol’ struct function.
p.s. – there’s an alternative way, using the Java bean adapter that is associated with each Matlab graphics object: java(hContour). Specifically, this object apparent has the public method browseableChildren(java(hContour)) which returns the list of all children (in our case, 41 text labels [bean adapters], 20 lines, and a single object holding a ListOfPointsHighlight that corresponds to the regular hidden SelectionHandle property). However, I generally dislike working with the bean adapters, especially when there’s a much “cleaner” way to get these objects, in this case using the regular EdgePrims, FacePrims, TextPrims and SelectionHandle properties. Readers who are interested in Matlab internals can explore the bean adapters using a combination of my getundoc and uiinspect utilities.
So far for the easy part. Now for some more challenging questions:
Customizing the color
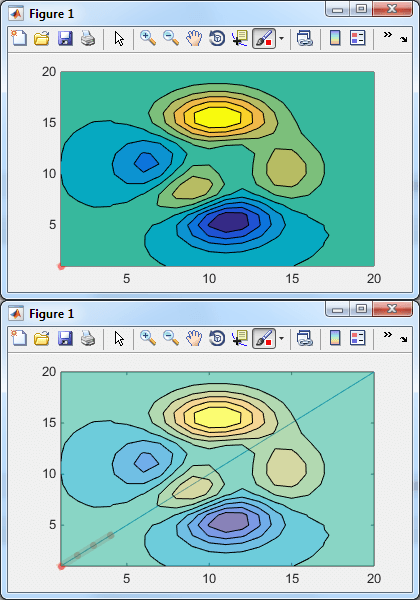
First, can we modify the contour fill to have a semi- (or fully-) transparent fill color? – indeed we can:
[~, hContour] = contourf(peaks(20), 10);
drawnow;  % this is important, to ensure that FacePrims is ready in the next line!
hFills = hContour.FacePrims;  % array of TriangleStrip objects
[hFills.ColorType] = deal('truecoloralpha');  % default = 'truecolor'
for idx = 1 : numel(hFills)
   hFills(idx).ColorData(4) = 150;   % default=255
end

Contour plot in HG2, with and without transparency
Similar transparency effects can also be applied to the LineStrip and Text objects. A discussion of the various combinations of acceptable color properties can be found here.
Mouse clicks
Next, how can we set a custom context-menu for individual labels and contour lines?
Unfortunately, Text, LineStrip and TriangleStrip objects do not posses a ButtonDownFcn or UIContextMenu property, not even hidden. I tried searching in the internal/undocumented properties, but nothing came up.
Mouse click solution #1
So the next logical step would be to trap the mouse-click event at the contour object level. We cannot simply click the contour and check the clicked object because that would just give us the hContour object handle rather than the individual Text or LineStrip. So the idea would be to set hContour.HitTest='off', in the hope that the mouse click would be registered on the graphic object directly beneath the mouse cursor, namely the label or contour line. It turns out that the labels’ and lines’ HitTest property is ‘off’ by default, so, we also need to set them all to ‘on’:
hContour.HitTest = 'off';
[hContour.TextPrims.HitTest] = deal('on');
[hContour.EdgePrims.HitTest] = deal('on');
[hContour.FacePrims.HitTest] = deal('on');
hContour.ButtonDownFcn = @(h,e)disp(struct(e));
This seemed simple enough, but failed spectacularly: it turns out that because hContour.HitTest='off', mouse clicks are not registered on this objects, and on the other hand we cannot set the ButtonDownFcn on the primitive objects because they don’t have a ButtonDownFcn property!
Who said life is easy?
One workaround is to set the figure’s WindowButtonDownFcn property:
set(gcf, 'WindowButtonDownFcn', @myMouseClickCallback);
Now, inside your myMouseClickCallback function you can check the clicked object. We could use the undocumented builtin hittest(hFig) function to see which object was clicked. Alternatively, we could use the callback eventData‘s undocumented HitObject/HitPrimitive properties (this variant does not require the HitTest property modifications above):
function myMouseClickCallback(hFig, eventData)
   hitPrimitive = hittest(hFig);  % undocumented function

   hitObject    = eventData.HitObject;     % undocumented property => returns a Contour object (=hContour)
   hitPrimitive = eventData.HitPrimitive;  % undocumented property => returns a Text or LineStrip object
   hitPoint     = eventData.Point;         % undocumented property => returns [x,y] pixels from figure's bottom-left corner

   if strcmpi(hFig.SelectionType,'alt')  % right-click
      if isa(hitPrimitive, 'matlab.graphics.primitive.world.Text')  % label
         displayTextContextMenu(hitPrimitive, hitPoint)
      elseif isa(hitPrimitive, 'matlab.graphics.primitive.world.LineStrip')  % contour line
         displayLineContextMenu(hitPrimitive, hitPoint)
      elseif isa(hitPrimitive, 'matlab.graphics.primitive.world.TriangleStrip')  % contour fill
         displayFillContextMenu(hitPrimitive, hitPoint)
      else
         ...
      end
   end
end
Mouse click solution #2
A totally different solution is to keep the default hContour.HitTest='on' (and the primitives’ as ‘off’) and simply query the contour object’s ButtonDownFcn callback’s eventData‘s undocumented Primitive property:
hContour.ButtonDownFcn = @myMouseClickCallback;
And in the callback function:
function myMouseClickCallback(hContour, eventData)
   hitPrimitive = eventData.Primitive;  % undocumented property => returns a Text or LineStrip object
   hitPoint     = eventData.IntersectionPoint;  % [x,y,z] in data units

   hFig = ancestor(hContour, 'figure');
   if strcmpi(hFig.SelectionType,'alt')  % right-click
      if isa(hitPrimitive, 'matlab.graphics.primitive.world.Text')  % label
         displayTextContextMenu(hitPrimitive, hitPoint)
      elseif isa(hitPrimitive, 'matlab.graphics.primitive.world.LineStrip')  % contour line
         displayLineContextMenu(hitPrimitive, hitPoint)
      elseif isa(hitPrimitive, 'matlab.graphics.primitive.world.TriangleStrip')  % contour fill
         displayFillContextMenu(hitPrimitive, hitPoint)
      else
         ...
      end
   end
end
This article should be a good start in how to code the displayTextContextMenu etc. functions to display a context menu.
Customizations reset
Finally, there are apparently numerous things that cause our customized labels and lines to reset to their default appearance: resizing, updating contour properties etc. To update the labels in all these cases in one place, simply listen to the undocumented MarkedClean event:
addlistener(hContour, 'MarkedClean', @updateLabels);
Where updateLabels is a function were you set all the new labels.
Prediction about forward compatibility
I am marking this article as “High risk of breaking in future Matlab versions“, not because of the basic functionality (being important enough I don’t presume it will go away anytime soon) but because of the property names: TextPrims, EdgePrims and FacePrims don’t seem to be very user-friendly property names. So far MathWorks has been very diligent in making its object properties have meaningful names, and so I assume that when the time comes to expose these properties, they will be renamed (perhaps to TextHandles, EdgeHandles and FaceHandles, or perhaps LabelHandles, LineHandles and FillHandles). For this reason, even if you find out in some future Matlab release that TextPrims, EdgePrims and FacePrims don’t exist, perhaps they still exist and simply have different names.
Related posts:
- Customizing axes part 2 Matlab HG2 axes can be customized in many different ways. This article explains some of the undocumented aspects. ...
- Customizing axes rulers HG2 axes can be customized in numerous useful ways. This article explains how to customize the rulers. ...
- Customizing axes part 4 – additional properties Matlab HG2 axes can be customized in many different ways. This article explains some of the undocumented aspects. ...
- Customizing axes part 3 – Backdrop Matlab HG2 axes can be customized in many different ways. This article explains some of the undocumented aspects. ...